
Figure Caption Electron microprobe element maps (128×128 µm) of rock varnish from Death Valley, California. The inset image at lower right is an optical microstratigraphy seen in varnish ultra-thin section under a polarized light microscope. As seen from the probe maps, silica (Si), aluminum (Al), magnesium (Mg), and potassium (K) achieve their highest concentrations in the yellow layer at the top of the varnish microstratigraphy (interpreted to represent the Holocene). In contrast, manganese (Mn), barium (Ba), calcium (Ca), and phosphorus (P) achieve their highest concentrations in the dark layers (interpreted to represent the last glacial time). Iron (Fe) shows the smallest glacial to interglacial change in concentration. With some exceptions, sulphur (S) is not generally associated with barium in varnish microlaminae during both glacial and interglacial time. The line profile of barium oxide content was taken along a vertical traverse and the probe mapped portion of the varnish microstratigraphy is marked by a square. This varnish contains a layering sequence of LU-1/LU-2/LU-3/LU-4 (WP6), suggesting a minimum varnish-based age estimate of 60 ka. Please see Liu (2003) for more information about varnish layering pattern interpretation and age dating.
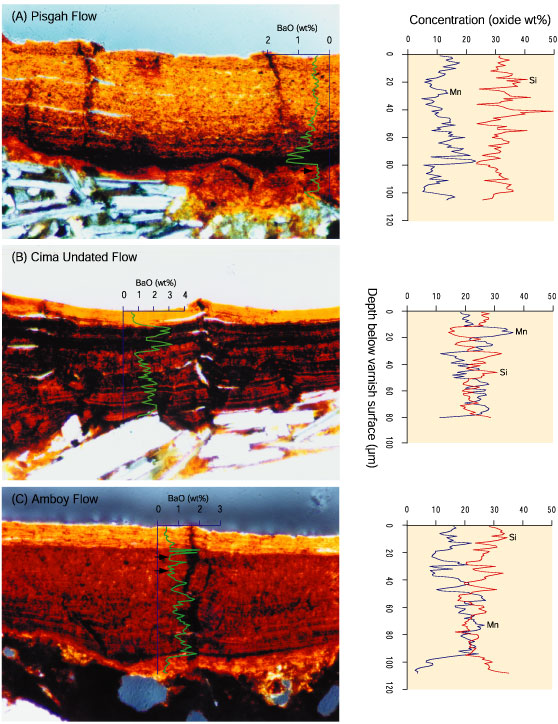
Figure Caption Optical (left) and chemical (right) microstratigraphies in rock varnish from late Quaternary lava flows in the Mojave Desert, California. The black layers in the varnish are enriched in Mn and Ba (but depleted in Si), and the yellow layers are depleted in Mn and Ba (but enriched in Si). The orange layers contain intermediate amounts of Mn and Ba. Note that the absolute concentrations of Mn and Ba in the outermost yellow layers change from sample to sample, but their relative concentrations are generally lower than those in the underlying black and orange layers. Also note that some orange layers in the varnish contain anomalously high content of Fe, as marked by the dark arrows in A and C, leading to extremely low content of Mn and Ba in these layers.

Figure Caption Optical (left) and chemical (right) microstratigraphies in rock varnish from three localities along an N-S traverse in the drylands of western USA. Note that Mn and Ba contents in the Holocene portion of each varnish microstratigraphy are much lower than that in the terminal Pleistocene portion of the microstratigraphy. Also note that the average Holocene Mn and Ba contents in the varnishes exhibit a general trend along the traverse, from the lowest in Death Valley to the highest in Ocotillo, which appears to reflect the present-day effective moisture gradient in southern California. WH1-WH12 and WP0 in the right panel identify Mn-rich peaks on each probe line profile that correspond to the Holocene and terminal Pleistocene dark layers seen in the optical microstratigraphies. WH = Wet event in Holocene, WP = Wet event in Pleistocene.

Figure Caption (A) Electron microprobe line profile analyses of Mn content in varnish microstratigraphy, with 2 µm resolution. (B) Optical microstratigraphy seen in varnish ultra-thin section with a polarized light microscope; arrows identify the position of probe traverse. (C) Microprobe X-ray mapping of Mn distribution in varnish microstratigraphy shown in (B), with 2 µm resolution. The color scale in this image represents relative concentration of Mn. Varnish sample was collected from I-3 terrace surface of Jingou He on the north flank of Tian Shan, western China.

Figure Caption (A) Electron microprobe line profile analyses of Mn content in varnish microstratigraphy, with 2 µm resolution. (B) Optical microstratigraphy seen in varnish ultra-thin section with a polarized light microscope; arrows identify the position of probe traverse. (C) Microprobe X-ray mapping of Mn distribution in varnish microstratigraphy shown in (B), with 2 µm resolution. The color scale in this image represents relative concentration of Mn. Varnish sample was collected from higher shorelines of post-Lisan age on the west bank of the Dead Sea Rift, Israel.

Figure Caption (A) Electron microprobe line profile analyses of Mn content in varnish microstratigraphy, with 2 µm resolution. (B) Optical microstratigraphy seen in varnish ultra-thin section with a polarized light microscope; arrows identify the position of probe traverse. (C) Microprobe X-ray mapping of Mn distribution in varnish microstratigraphy shown in (B), with 2 µm resolution. The color scale in this image represents relative concentration of Mn. Varnish sample was collected from a morainal boulder of latest Pleistocene age in Rio Mendoza Valley, Argentina.